30 Mayıs 2012 Çarşamba

KUOW Hike of The Week- Iron Bear

To contact us Click HERE
Updated May 29, 2012Iron Creek to Teanaway Ridge (aka Iron-Bear trail) is a great spring hike with lots of flowers now. Patchy snow close to 5000 feet.All photos and trail updates from Kim Brown. Thanks KimPhoto below is view of the Stuart Range and other snow covered peaks

Check out Green Trails Maps for directions. Map for this week's trip is 210. Click link below for complete list of maps.http:// http://greentrailsmaps.com/maps/index_Map_wa/


Photo below is hiking in the forest

Photo below is of balsamroot flowers
Photo below is of glacier liliesflowers
Photo below is the open views you get in the East Cascades
Driving directions: Drive east on Interstate 90 to US 97. About two miles north of Mineral Springs, look for Forest Service Road No. 9714 (Iron Creek Road) going off to the left (west). Continue about 3.5 miles to road's end and the trailhead and parking at 3,800 feet.


Trail stats: From the trailhead to the high point (5489 feet) is about 6.4 miles round trip.Directions and trail stats are our best estimate however please have a good local map and or a GPS unit.
Custom Weather Forecasts & Services
West Coast WeatherContact us

Soil Temperatures and Gardening

To contact us Click HERE
The question that many amateur gardeners like myself often ask is:

Why are my seeds not germinating and rotting in the soil?
When will the soil be warm enough to sow my seeds or transplant my plants?

Well, I don't pretend to be an expert in this, but I suspect it has something to do so with the temperature of the soil.

You can purchase or adapt a thermometer for taking soil temperature measurements
Lets talk about soil temperature and how this compare to air temperature, a subject that is interesting beyond gardening.

The first thing to keep in mind is that the temperatures you hear about on TV or read about in the newspaper are for the air temperature, in shade, at a height of roughly 2 meters (6 feet).   So when meteorologists talk about surface air temperatures...that is what we mean.  And such temperatures SHOULD be taken above native vegetation, which is increasingly rare.

Now the temperature of the ground surface is often quite different than the air temperature.  During sunny days, ground temperatures can be much warmer than the air temperature (10-40F is not unusual), and on a cold, clear winter nights, when the ground radiates heat to space, the ground temperature can be 1-8F cooler than air temperature.  After relatively warm periods, heat conduction from the warmed soil below can keep the surface temperature warmer than the air temperature at night.

Several of these characteristics are evident in this plot of surface and ground temperatures at the WSDOT road weather site at Silica Road (near Quincy in eastern Washington, along I90) for Sunday.  Time advances to the left in this figure.   The road temperature zoomed up to roughly 105F, while the air temperature was in the low to mid 60s!  Wow.  And last night the air temperature was cooler than ground temperature as the former dropped in the upper 30s.

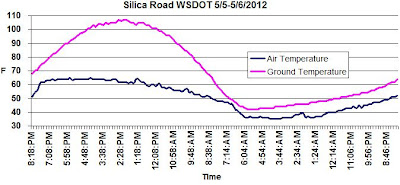
 Such super-large temperatures changes just above road surfaces lead to the famous water on the road mirage (see my book for details on this).


Now what about the soil temperatures?  The deeper you go into the soil the weaker the daily temperature variation becomes, with the soil temperature increasingly  reflecting the average temperatures of the weeks and months before as one descends.  Here an example of the soil temperatures at roughly 1 inch (2.4 cm), 6 inches (15 cm), and 12 inches (30 cm).  Lots of daily variation in the top inch (in this case a range of 30F), but only a 2F range at 12 inches.  And you can see it takes a while for the warming to propagate down into the soil.   Go down 5 feet or so and the temperature hardly varies throughout the year.

So what are the current soil temperatures around the State?   Lets look at soil temps at 8 inches down from the highly useful Washington State University AgweatherNet .  Here are the values today...mid 50s over western Washington and the mid to upper 60s over the western portion of eastern Washington (60 and above are in yellow).

 Now lets examine  the 8-inch deep soil temperatures in Seattle since January 1 (see graph).  A steady rise until the cold spell this week, and now it is rising again with the warmer days. Roughly upper 50s F.


 Ok, so what does this have to do with the germination of vegetable seeds....and particularly why my bean seeds are just rotting in the soil?

Take a look at the typical soil temperature required for germination of various seeds (see below).  Big variations.   Here in western Washington we are now good to go for corn, spinach, carrots, and peas (not shown, but ok at 50F).  But beans need soil temps in the 60s.  Boy did I make a mistake planting those too early!   Next time I will check the soil temperatures before I sow. 

Vegetables or not, soil and ground temperatures are fascinating, and during the winter knowledge about them can save your life when roadway icing is threatening.

Understanding Ellensburg's Wind

To contact us Click HERE
As we move into the late May and June regime of low clouds (a.k.a. June gloom), experienced west side residents know that crossing the Cascades--east of Cle Elum and down into Ellensburg-- can bring welcome sun.  A fancy resort, Suncadia, has been built for sun-starved travelers in Cle Elum, and even more sun can be found if you descend I-90 to Ellensburg and Vantage.  Even Knute Berger, the old mossback, recommends Cle Elum sun in a recent Crosscut piece.

But there is problem.   During just the days when the east-side offers the brightest contrast to the dreary west, westerly winds descend into the Kittitas Valley, causing the stretch from Cle Elum to Vantage to become a wind tunnel, with sustained winds of 20-30 mph and gusts that sometimes hit 50. 

Some folks say that in Ellensburg there is only one four letter word best for cussing: WIND.  And the Ellensburg Safeway has a unique wind measuring devise for their customers.


Now I have enjoyed the Suncadia resort in Cle Elum a few times, but it is sufficiently exposed to the westerly winds that the extensive golf courses are perhaps a bit more of a challenge than novice golfers might have reckoned with.  The golf pro at Suncadia is highly in demand for this insightful lessons in avoiding wind-driven hooks or slices.  Here is a sample (click on picture) that was sent to me by a local golf enthusiast.  Listen to his detailed instructions on the proper swing for windy conditions:


Strong westerly winds are found in this region when there is a large pressure difference across the Cascades, with higher pressure to the west.  Such a large pressure different in most prevalent in the spring and summer.  Why?  In spring high pressure builds northward in the eastern Pacific, while the warming of the interior of eastern Washington leads to pressure falls, since warm air is less dense than cold air.  To illustrate this pressure pattern, here is a 12-h pressure forecast valid 5 PM last Friday, a day when the winds were quite strong in Ellensburg and vicinity:


Air looks for the easiest path across the Cascades, and the Snoqualmie/Stampede Pass complex is the lowest route across (roughly 3000ft) north of the Columbia Gorge.  Cool, cloudy days with strong onshore flow are often associated with high pressure in the west---that can juice the pressure difference and the winds.

Spring and early summer are the best times for strong winds moving into the Kittitas Valley and thus the period of best wind energy potential for the many wind turbines in the area.   Unfortunately, this is the period of greatest snowmelt, streamflow, and hydropower potential--leading to contention between these two sources of clean energy.  Why contention?   Lack of energy transmission capability.  I wish some of the stimulus money could have been used to fix this deficiency.

The UW ultra-high resolution WRF forecasts do a pretty good job in simulating the strong winds along the eastern slopes of the Cascades...here is a sample (the shading shows the sustained wind speed) and the brown lines are sea level pressure.  You will note that the region from Leavenworth to Wenatchee get some winds too..they are downwind of the Stevens Pass gap...a lesser one. 

The strongest winds are often east of Ellensburg on Whiskey Dick mountain--the ridge on which Puget Sound Energy has placed their Wild Horse Wind farm. Very nice visitor center there if you want to visit.  Want sun and no wind?  No problem.  Drive down to Vantage and head north towards Quincy....the winds are less there.


Let me end with a plot of the sustained winds at Ellensburg during the past six months...they can get strong winds any time of the year...but you see the increase around March 1 and the beginning of the spring pressure patterns.

Memorial Day Weekend Outlook

No major storms.Friday and Saturday will be sunny and seasonably warm (60s).Clouds and a few sprinkles on Sunday and Monday-highs around 60.


Strong Thunderstorm Hits Portland

To contact us Click HERE
 For the second day in a row,  convection and thunderstorms developed over the Cascades and rolled into the western lowlands...in this case hitting southwest Washington, Portland, and the northern Willamette Valley.   Mark Albright, past WA state climatologist, reported that an observer in downtown Vancouver just W of I-5  reported 0.40 inches of rain in 5-minutes from 19:29 to 19:34 PDT 26 May 2012.  The highest hourly amount from the Portland Hydra network (46 sites) seemed to be the 1.34 inches over one hour from 19:00 to 20:00 PDT reported at Hayden Island just west of I-5.  This is extraordinarily heavy precipitation--heavier that the downpour that hit Seattle in December 14, 2005.....the event that flooded parts of the Madison valley.  Most gutters simply can't handle this intensity.

Take a look at the Portland radar at 7:26 PM Saturday....see those reds?...that is torrential rain.


Here is the storm total precipitation from the radar...you can see the track of the heavier rainfall.


Did the models get it right?....unfortunately, not....again they failed.  As proof, take a look at the forecast 24 h precp ending 5 AM Sunday....not good.  This summer I plan on examining this event in detail....hopefully finding the origin of this failure.  But convection is hard to forecast, particularly weakly forecast convection.


Here are two good youtube videos of the event:


First one.
Second one


Extraordinary Skill for Extended Weather Forecasts

To contact us Click HERE
How far into the future are weather forecasts skillful? 

By that I mean:  how far into the future can we forecast specific weather features--perhaps the intensity and position of a low pressure center or the position of a front or whether they will be rain during the early morning hours.   Such forecasts contrast with climate prediction, where we attempt to predict the general nature of the weather over a period...say the average temperatures for the spring.

Lately we have increasingly seen forecast skill extend well past a week...and in some cases, extending to nearly two weeks....and in this blog I will show you a few examples.

A lot of research was done on this topic--determining the limits of predictability-- both from  theoretical and modeling perspectives.  For example, meteorologists such as Edward Lorenz and Joseph Smagorinsky would run weather forecast models many times, each starting from a SLIGHTLY different beginning--well within observational error.  They would see how long it would take before the forecasts would become very different.  Generally, it took about two weeks, but there is nothing unique about that period.   Sometimes forecasts would diverge after a few days, while in other situations the forecasts held together much, much longer.  The implication is that during some periods we find that forecast skill, even with a perfect forecast model, is lost quickly, while in other periods we might skillfully predict the weather for weeks.
The ability of a small change in the initial forecast state to eventually cause a big change in a forecast is known as the butterfly effect, since the atmospheric disturbance of a butterfly flapping its wings would eventually alter a forecast a long time into the future.

In the early days of forecasting, when our forecast models were crude and our observational resources were few, weather prediction could not get close to the theoretical limits.  But during the last decade or so, with the availability of satellite data, fast computers, and far better computer models, prediction skill has extended further and further out in time.   In the 60s-80s we were lucky to skillfully forecast out 2-3 days.  In the 90s 3-4 days.  And in the 2000s, 4-5 day forecasts were often quite skillful.  But recently, we have seen highly skillful forecasts consistently at 5-7 days, and occasionally approaching two weeks.

Want to see some examples?  Here is a 360 hr forecast (15 DAYS) from a National Weather Service ensemble weather prediction system for the height of the 500 mb pressure surface.  Specifically, it shows the predicted anomaly (difference) from normal of the mean of a large collection of forecasts (the ensemble).  Note the HUGE (orange color) high height anomaly in the north Pacific.


 Next, here is a 192 hour (8 day!) forecast valid the for same time.  The feature is still there.

Finally, here is a 24-hr forecast verifying at the same them..this should be pretty much exactly what happened.....the feature is still there...albeit distorted a bit.  You will note that the 192 hour forecast


 got a number of other features correct...or nearly correct...as well.

Or examine the 240 h (10 day) forecast by the European Center for Medium Range Forecasting and compare it to the 24 hour forecast for the same time.   The images below show 500 hPa heights and 850 hPa (around 1500 meters) temperatures.  Not perfect, but a number of features are very similar...useful forecast skill there!


Or a recent example--a forecast at 500 hPa made 7.5 days ago for today at 5 PM....and a 12-h prediction for the same time.  A lot of the same features, although there are some minor differences in phasing and amplitude.
The general consensus is that we will see such skill extend out further in time, by at least one day per decade.   There is a limit to this extension of forecast skill...but there is much we can do to improve our predictions more--so improvements should continue for a while.
So when people ask you how far into the future meteorologists can predict the weather, a good answer is:
2-3 days with excellent skill3-4 days with moderate, but useful skill5-6 days with marginal skill..and occasionally skill extending out 7-10 days.
Yes...sometimes forecasts go wrong in less than a day...but is considerably less frequent than a decade ago.


26 Mayıs 2012 Cumartesi

KUOW Hike Rattlesnake Mt

To contact us Click HERE
This week's we can hike 2 miles to Stan's Overview or up to 4 miles (Grand Prospect) with no snowshoes. If you want to go to top of Rattlesnake (5.5 miles) you will need snowshoes. Trail is west of North Bend off of I-90. No rattlesnakes here.
Photo below view of Mt Si from Stan's Overview, photo by Karen Sykes

Check out Green Trails Maps for directions. Map for this week's trip is 205S. Click link below for complete list of maps.http://"> http://greentrailsmaps.com/maps/index_Map_wa/

Photo below is view just 1 mile into the hike looking north, photo by Michael Fagin
Photo below is 2 hikers in the woods, photo by Karen Sykes
Photo below almost at our turnaround point, 4 miles in, still no snowshoes, photo by Karen Sykes
Photo below is view from Grand Prospect, photo by Michael Fagin
Driving Directions::Take I-90 east to Exit 27 then go right and follow the road to the end. Need Discover Pass. This is the Snoqualmie Point trailhead
Trail Statistics: Roundtrip 10.9 miles, Elevation Gain 2520 ft High Point 3500 ft
Bring map and compass and or GPS.
Custom Weather Forecasts & Services


West Coast WeatherContact us

KUOW- Lanham Lake

To contact us Click HERE
Updated: 3-6-2012
This snowshoe is just several miles east of Stevens Pass on Hwy 2. Park next to the Nordic Center. Best days to get views would be this Wednesday and Thursday.
Photo below is the view of Jim Hill Mountain from the lake. Only 1.5 miles from the trail head, photo by Michael Fagin


Check out Green Trails Maps for directions. Map for this week's trip is 144. Click link below for complete list of maps.http://"> http://greentrailsmaps.com/maps/index_Map_wa/

Photo below is group on snowshoes on the way to Lanham Lake, photo by Michael Fagin
Photo below is view just 20 minutes into the trip, we believe this is Arrowhead Mt, photo by Michael Fagin

Photo below is Lanham Lake, photo by Michael Fagin
Photo below is our desert, macaroon cookies, thanks Mike S
Photo below, view of Big Jim Mountain, photo by Michael Fagin
Photo below is good signage to Lake on lower portion, photo by Michael Fagin
Driving Directions: From Seattle this is on Hwy 2 and it is 6 miles east of Stevens Pass and got to the Mill Creek exit on the right. This is also parking for Nordic Center. Park in lower lot, outside of the Nordic Center.
Trail stats: Walk inside to the Nordic Center and turn left and walk short distance on the trail. Signage to the right directs you to Lanham Lake. 3.2 miles roundtrip and about 1100 foot gain. Lake is at 4100 feet.
Bring map and compass and or GPS as directions are our best estimates.
Custom Weather Forecasts & Services


West Coast WeatherContact us

KUOW Hike- Ingall Creek

To contact us Click HERE
Update Tuesday May 8, 2012This hike is north of Blewett Pass (US 97) in between Cle Elum and Leavenworth. Flower-Flowers- Flowers and snowfree for at least 4 miles

All photos by Alan Bauer Photo below is Glacier Lily


Check out Green Trails Maps for directions. Map for this week's trip is 210. Click link below for complete list of maps.http:// http://greentrailsmaps.com/maps/index_Map_wa/

Photo below is Ingalls Creek
Photo below is Glacier Lilies that line the trail
Photo below is Michael Fagin next to giant Ponderosa Pine
Photo below is Spring Beauty
Photo below is of happy hiker having finished lunch soaking up summer sun (Michael Fagin)
Driving Directions (thanks Alan Bauer): From Seattle I-90 east , exit 85/US-97. Drive to Blewett Pass, then 14 miles north of Bewett Pass turn left on Ingalls Creek Road. Drive Ingalls Creek Road 1.1 mile to roads end at trailhead.
Trail stats (thanks Alan Bauer: USFS Pass required. Start elevation 1950’, 3.25 miles in at 2900’, four miles in is 3100’ start to get patchy snow.Directions are the best estimates that we have so please bring map and compass and or GPS.


Custom Weather Forecasts & Services

West Coast WeatherContact us

Final