To contact us Click
HERE
The main tool used by meteorologists to predict the nature of the weather months ahead is the correlation of the temperature of the tropical Pacific ocean surface and the atmospheric circulation around the globe. To put it another way, meteorologists use the correlation of the El Nino and La Nina cycle (called ENSO-El Nino Southern Oscillation in the business) with midlatititude weather. This correlation is
not perfect, but it is the most potent tool we have for predicting a few months ahead.
As with any good tool, you need to know how to use it, as well as its limitations.
One key rule is:
don't make your winter predictions too early! A lot of research, including that of UW's Todd Mitchell, have shown that one really needs to wait until very late summer to have real skill for predicting the character of the upcoming winter. Thus, I like to wait until late September: by this time we can have high confidence that we have a handle on the general nature of El Nino/La Nina for the winter months. So I feel comfortable giving you a prediction at this point. A second thing to keep in mind is that this tool is imperfect, explaining perhaps a third to a half of the winter variability.
OK, enough caveats and warnings. Let me give you the story!
For the last two years we have been in a La Nina situation (colder than normal central and eastern tropical Pacific sea surface temperatures), which is generally associated with greater mountain snowpack, colder temperatures, and increased chances of lowland snow, particularly after Jan 1. And generally it delivered---Cascade snowpacks have been high and our last two springs were dismally cool and wet. But this year La Nina has collapsed and the tropical Pacific has warmed, leading to a weak El Nino. This graph shows the sea surface temperature anomalies (differences from climatology, blue colder than normal, orange is warmer) for several tropical Pacific regions (the Nino 3.4 region is the most used) since October 2011. We have a pretty wimpy El Nino at this point (anomalies only about .5C) and lately it has weakened substantially.

At this point in time, we would expect this winter to be an El Nino one, simply on the basis of persistence---since it takes a while for the ocean temperatures to shift.
But we have more sophisticated tools.
First, there are a series of models--some statistical, some simulating the ocean/atmosphere system--that provide a forecast of what is happening over the tropical Pacific. Here is a nice collection that I accessed on the NOAA Climate Prediction Center website. Most of the models suggest a slight warming (increase in El Nino) this fall, followed by a slow weakening. The definition of El Nino requires that the warm anomaly be at least .5C and we are just over that now and slide below it next Spring. If the anomaly is between plus or minor .5C of normal then we are in a neutral or "La Nada" year.

The National Weather Service also runs their global coupled atmosphere/ocean model (the CFS) out many months. Here is what it is showing. Same wimpy, marginal El Nino, and on the verge of being a La Nada year.

But this El Nino/ENSO stuff is interesting perhaps, but what you REALLY want to know is what we expect for the upcoming winter, right?
First, the bottom line. El Nino years tend to produce Northwest winters that are warmer than normal, drier than normal, with less than normal mountain snowpack and a lower probability of lowland snow. They tend to be less stormy here, with more of the action going into California.
The greatest impacts are generally after January and the strength of the effect is dependent on the warmth of the tropical Pacific. The following graphics illustrate the impact across the U.S. of El Nino's during January though March. The first shows preciptation--a really modest decline over the NW and an increase over the southwest U.S.

For temperature, warming over the northern tier of states.

The issue, of course, is that this is looks like a very weak El Nino at this point and the impacts will be thus attenuated. The result: less signal and thus less forecasting skill.
We could easily be a near neutral situation (La Nada) the end of the winter, and those can be interesting periods, since the biggest of the big events (floods, windstorms, even snowstorms) tend to occur in neutral years.
So keep your eyes on the tropical Pacific temperatures--perhaps our models will be wrong.
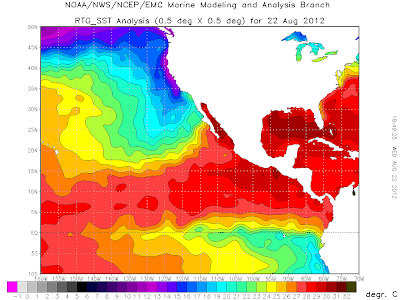 We can take a closer look off the Oregon coast by viewing the SSTs forecast by the Oregon ROM ocean modeling system (I used the NANOOS web site to plot this). Lower to mid-50s along the coast while lower 60s are waiting 100 miles offshore.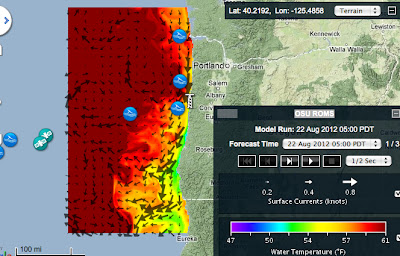

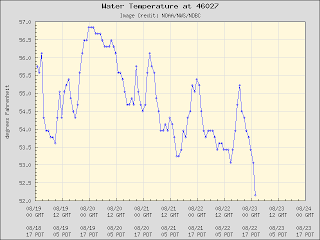 But head out to Buoy 46006 and temperatures in the in sultry mid to upper 60s.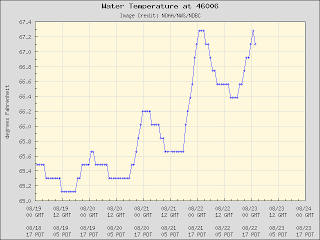


 Multiple such urbanization/development issues at locations around the world, and it is clear that it can obscure the true background temperature change signal that we are looking for. Organizations, such as the National Climatic Data Center, have tried to develop algorithms to spotlight or remove such problems, but there success so far is mixed. Satellite observations of temperature above the surface are a bit less problematic, although they have their own issues (like calibration of replacement satellites).

 The latest radar image from Miami shows bands of intense showers rotating around Isaac's center:


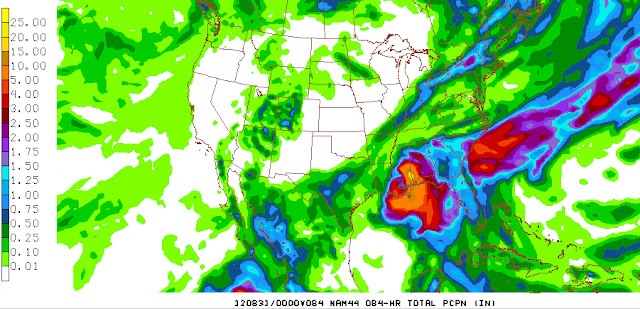 Pretty impressive precipitation.

 Photo below is view of the lake
 Photo below is view from the top of Labyrinth Mountain of Glacier Peak
 Photo below is view from the top of Labyrinth Mountain of Minotaur Lake
 Driving directions: From Everett head east on US 2 for 65 miles to Stevens Pass. Continue east for another 4 miles. onto Smith Brook Road (Forest Road 6700). (From Leavenworth reach the turnoff in 30 miles.) Follow FR 6700 and go past Smithbrook trailhead and then past Nason Ridge Trailhead. At about 4 3/4 miles from Stevens there is a sharp left fork and take this and this is still FS 6700. Than at 6.8 miles from Stevens Pass turn left onto FR 6704. Proceed for 0.9 mile to the road's end and trailhead (elev. 3800 ft).
 Photo below is Grand Park- 2 miles of meadows
 Photo below is lunch break in the meadow
 Photo below is Michael Fagin taking a nap
 Photo below is Maria dancing in the meadow
 Photo below is of meadow and Mt. Rainier
 Driving directions: Drive state Route 410 about 24 miles east of Enumclaw and just past the viewpoint of Mount Rainier turn right onto Forest Service Road No. 73. Drive 10 miles to sign that says “Eleanor Creek.” There is not a trailhead sign but park on the right and you will see a boot path on the left. Walk a short distance and you will see sign that you have entered the National Park.Trail stats: 7 miles roundtrip and about 1500 foot elevation gain. You can go slightly further if you like.Please bring map-compass-GPS as these directions are our best estimates.