But what has not been discussed in depth is the extraordinary transformation that will occur as Sandy makes landfall and moves inland....from a tropical to an extratropical storm, the first with a warm core and the latter with a cold core. I will talk about that here.
Right now Hurricane Sandy is almost exactly one day from landfall on New Jersey. It possesses sustained winds of 75 mph and a central pressure of 950 hPa, and is very large storm and will expand even more. Here is a recent infrared image, showing the band of moisture feeding into the center of the storm.

As I have mentioned before, hurricanes and tropical storms derive their energy from the warmth and moisture of warm oceans, and Sandy is no exception. Such tropical storms are warm-core systems, with the warmest air in their centers. In general, tropical storms are not found in regions with large horizontal changes in temperature.
Recently, there has been a substantial warm anomaly of the sea surface temperature (SST) of the western Atlantic (SST much warmer than normal), which helps tropical systems like Sandy move northward and stay strong longer than normal. Here is a recent map showing the SST anomaly: much warmer than normal along the path of Sandy, by over 1.5C! So a very attractive welcome mat had been laid for tropical storms over the western Atlantic.

Now midlatitude or extratropical storms get their energy not from warm oceans, but rather horizontal temperature changes---generally warmer to the south, cooler to the north. It turns out that the temperature changes on our planet are concentrated in the midlatitudes...and this temperature gradient fuels nearly all of the storms we experience in the winter. Midlatitude storms tend to be cold-core, with the coolest temperatures in their center.
Sometimes a tropical storm moves northward and undergoes an amazing transformation, from a warm core tropical system to a cold-core extratropical system, and switches its energy supply from the warmth and moisture of a tropical ocean to the temperature gradients of the midlatitudes. This is called Extratropical Transition (ET) in the business.
Sandy is about to go through the transformation.
Let me show you. The figures below show you the temperatures and pressure pattern (actually heights of the 850 hPa pressure surface) at around 5000 ft above sea level for three times (Monday morning, Monday evening, and Tuesday morning--Seattle Time). At the initial time there is warm air at the center of the storm (the dark orange color). Fairly symmetric structure (which is typical of tropical systems).

By tomorrow evening, just as the storm is making landfall, the warm core is fading, and temperature structure is becoming much more asymmetric.
 By Tuesday morning, the transformation is complete....cold air has reached the center of the storm and the warmest air is found far to the east of the center
Many tropical storms weaken when they go through this transition, but for a small subset the opposite occurs. The two energy sources work synergistically for a while, resulting in an strengthening and expanding system....such is the forecast fate of Sandy.
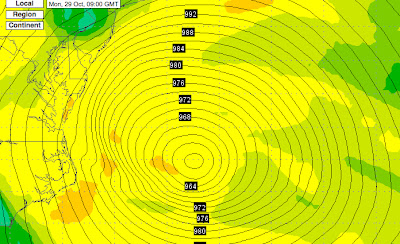
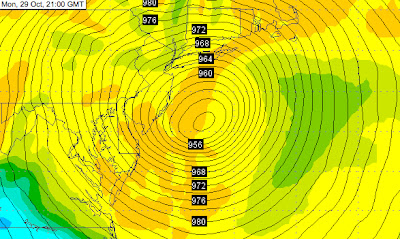
In fact, during this transition stage, Sandy will continue to intensity until it makes landfall. Here is the latest forecast from the NWS NAM model:
956 hPa low center at 2 AM Monday morning (PDT)
12 hours later 948 hPa pressure (2 PM Seattle Time).
My next blog will take a look at the scorecard for this storm....and return to talking about Northwest weather. And there is a lot to talk about, including an atmospheric river situation setting up and 5-10 inches forecast over the next 72 hr over NW mountains.


 With a large low center center over the NE Pacific and persistent strong flow pushing eastward to our south, northern CA is going to get hammered during the next several days.
 From weather satellites that measure atmospheric moisture, we can see the narrow plume of water vapor...an atmospheric river..that has been feeding the California rainfall.
 Tonight I will premiere a new figure created by UW WRF modeler Dave Ovens: 72hr snowfall! Lots (feet) of snow over the mountains of BC, and the higher elevations in the Cascades do very well indeed (foot or more). Most of the accumulation at pass and ski area elevation will occur later in the weekend as the freezing level drops and the wind direction becomes more westerly. The Sierra Nevada range goes to white (literally)--more than 45 inches of snow at higher elevations! The folks at Tahoe must be salivating.
  Here is a close up of the 72h snowfall ending on Monday at 4PM for Washington. Baker and Rainier will be buried. Stevens, at least a foot. Snoqualmie will pick up a half-foot or so. Not sure whether it will be enough to allow them to open.

 pressure observation and your location (smartphones use GPS and/or cell phone tower triangulation) to a central database, and allows you to view the observations taken by others. Here is a screenshot of the graphics provided by the app:


 These figures show the analysis of our data assimilation system with (left) and without (right) additional pressure observations. No contest...pressure really helps.
 Let's start with a plot of the probability of getting at least a trace of precipitation (.01 inch) anytime during the day for Seattle Tacoma Airport:
 There is roughly a 50-70% chance from early November through April 1. Sothe odds are, if you stand out there all day, you will get wet. Duh!
 Now most Northwest natives understand this--you can find a few dry hours on almost any day to have fun or do your chores (like remove the leaves from the street drains!). Few days are complete wash outs. If you use the weather radar effectively, you can see the dry periods and time them for maximum advantage. Or befriend a meteorologist!

 But there is a very positive side to this deluge: with large precipitation additions recently, both snowpack and reservoir levels are near average over most of California, for a good start to the water season. California needs water. Eventually, when human-forced global warming hits, they will have real water problem. But not this year.
 This is a favorable pattern for snow, with far lower freezing levels. Finally, it should be cool enough so that Snoqualmie will get enough white stuff to open. Here is the 72 h snow total from the UW WRF model. Over a foot in the Washington Cascades, a feet over some favored locations.
 This pattern continues into early next week. Take a look at the upper level map for Monday at 4 PM... an even bigger ridge. But don't expect that we will be cloud free and completely dry...there is plenty of flow over us and weak disturbances will southward down the eastern flank of the high.
 Anyway, this will be an opportunity for things to dry out a bit and winds should be more modest for the entire region.

 Photo below is new trail
 Photo below is a good stopping point at 3.2 miles one way. This log crossing can have ice on this time of the year. A bench for lunch no less, Alan is waiting for room service lunch. Photo @ Dennis Long
 Photo below is view of the ridge running from about Green Mt to Bessemer photo @ Dennis Long
 Photo below is for those that want to take risk of going to lake need to cross. About 30 feet long.
 Driving Directions: From Seattle, drive east on I-90 to exit 34 . Turn left (north) onto 468th Street and follow it to the junction with the Middle Fork Snoqualmie Road (Forest Road 56). Turn right and continue up the Middle Fork Snoqualmie Road to the end of the pavement (about 3 miles from the I-90 exit). Turn right onto a gated road and park, being sure not to block the gate.