13 Ekim 2012 Cumartesi

The Faucet Turns On

To contact us Click HERE


This year we have experienced one of the most profound late summer/early fall dry spells and it is not ending in a subtle way.  The rain is coming back with an abrupt and powerful transition, bringing particularly heavy amounts over the Olympics, north Cascades, and the mountains of Vancouver Island.

As you know, we have had virtually no rainfall over the region since late July, resulting in many drought records at locations on both sides of the Cascades.   Now take a look at the forecast predicted by the UW WRF model for the 72 hours ending at 5 AM on Tuesday (both regional and WA views, click to get a larger image).  In the Olympics, north Cascades, and southwest BC terrain (particularly Vancouver Is) amounts reach 5-10 inches, with a few higher values on the windward slopes.  Wow.   Although rainshadowed by the Cascades, even eastern Washington gets significant rain.  Sequim, Port Townsend, and nearby will receive less rain, being in the Olympic rainshadow. 

At this point, the hydrologists at the National Weather Service are not going for any flooding, since the rivers are starting out so low and land is bone dry, but one drainage is predicted to hit about 90% of bankfull...the infamous Skokomish River:  That river is extremely flood prone due to logging.


 The reason for this abrupt change in weather is a major shift in the large scale atmospheric flow pattern.  Let me show you the upper level pattern (500hPa--around 18,000 ft) average over five days centered on last Friday at 5 PM.  The black lines are the heights of this pressure surface and the winds parallel the black lines (ignore the colors!). Huge ridge over the northeastern Pacific.  Where the lines are packed together the winds would be strong..the jet stream..and that was heading into Alaska.  Wet times in Alaska.

 Now lets look at the same fields centered tomorrow (Sunday) at 5 PM.  See the difference?  The ridge is gone and now the jet stream is heading right into us...and the jet stream brings the storms.  And the rain.

Well, what about the upcoming week?  Here is the same upper level plot centered on Wednesday afternoon. That pesky jet stream is here to stay for a while and our weather is returning to normal.


Good for our water bills, good for our forests and street trees, and good for those tired of the pressure of thinking you needed to be recreating in the mountains or bike paths. You can balance your checkbook now.

Finally, rain is not the only thing coming back...strong winds will as well.  But these winds will be localized:  along the coast and over the waters of NW Washington.  Here is a WRF forecast of near-surface sustained wind speed for Sunday at 11 AM.  No big deal over Seattle.

And if you are desperate for sun, it will be available today and much of tomorrow in eastern WA.

10 Ekim 2012 Çarşamba

Washington Cascades- Extended Weather

To contact us Click HERE
Updated 10-10-2012
Forecast models are starting to indicate a major shift as we move away from the very dry pattern of a ridge of high pressure that has been over our region for the last several months will finally shifts out of our region. We go to a westerly moist zonal flow at least for the next several weeks. With this pattern precipitation will be above normal with temperatures close to normal conditions. The map below (500 mb) confirms this pattern westerly flow that is set up off the West Coast through October 23.


The Columbus Day Storm 50th Anniversary

To contact us Click HERE
It was the most powerful and destructive storm to strike the Northwest since the arrival of European settlers.

AND it was probably the most powerful non-tropical cyclone to strike the lower-48 states during the past century.

The Columbus Day Storm occurred on October 12, 1962, with the fiftieth anniversary this week.

I have thought a lot about this event, partially because one of my research areas has been intense Northwest storms and in part because I am giving a talk on Thursday at Kane Hall.

The winds during the storm were amazing (see graphic of peak gusts, courtesy Wolf Read). Over 145 mph at Cape Blanco, 138 mph at Newport, over 130 mph at Mt. Hebo, 160 mph at the Naselle radar site in SW Washington, 116 in Portland, and 100 mph in Renton (so those people who put down Renton keep this in mind!). 


The central pressure of the Columbus Day Storm (CDS) dropped to approximately 955 hPa and was equivalent in pressure and winds to a category 3 hurricane (like Katrina as it struck New Orleans).    I have little doubt that if the CDS hit today it would result in many billions, if not tens of billions, of dollars of damage.  The Columbus Day Storm was FAR stronger than the "Perfect Storm" (Halloween 1991) of movie fame.  I mean it wasn't even close.


Before the storm was over 46 people had died, 317 were hospitalized, and 15 billion board feet of timber, enough to build 300,000 homes, had fallen.  Millions had lost power, with the twin high-tension power lines to Portland toppled like some children's Tinker Toys.

An interesting aspect of this storm was that is started as Typhoon Freda in the western Pacific.  Moving northward, this storm weakened and transitioned into a midlatitude cyclone.   In doing so, it switched energy sources from the warmth and moisture of the tropical Pacific to the differences in temperatures found in the midlatitudes (sort of a meteorological version of a hybrid car).  Moving across the Pacific, it swung south into a large trough over the eastern Pacific and then moved northward along the West Coast, growing very rapidly (see graphic of the path over the eastern Pacific of that storm and a few other big ones).


Here is a surface analysis (by Lynott and Cramer 1966) when the storm was immediately off the Oregon coast around 3 PM on October 12th).  Huge pressure gradients (differences) along the coast, which resulted in the amazing winds.

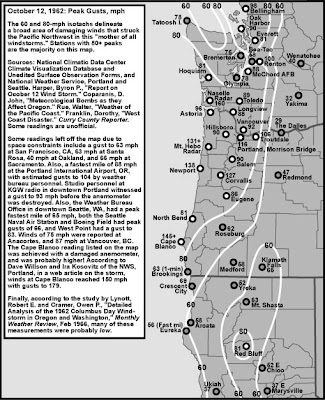
Did they forecast this event skillfully?  Alas, the answer is no.  The weather prediction made on October 11th was for improving conditions and no storm.  Only early on the 12th, when some ominous ship reports were received, did Weather Bureau forecasters realize that there was a serious storm approaching the region.

At my presentation on Thursday I will show a simulation that Rick Steed of my group made of this storm using a modern weather prediction system (WRF model).  We still failed to get a good forecast and I think I know the reason:  lack of enough data over the Pacific to initialize the model.  But don't worry, today we have so much information over the oceans (satellite data, aircraft information, buoys) that I have little doubt we would get the forecast correct.  In fact, my colleagues at the National Weather Service have not missed a major Northwest windstorm a day out since roughly 1990.


8 Ekim 2012 Pazartesi

Depression from Too Much Sun?

To contact us Click HERE

I can't tell you have many people have told me that the incessant sun and warmth is getting them down... making them feel anxious or depressed.   Well, I did some checking online and believe it or not, there is a real syndrome that strikes many thousands of folks during warm, sunny stretches:  Summer SAD(Seasonal Affective Disorder), summer mania, and other names. And it seems the people who live in a generally cool, cloudy area...at least in winter (like us and England)....are particularly susceptible.  Surprisingly, quite a few articles on it.  For example:


 Here is a striking quote from an individual that came from Seattle:

 "It's the unrelenting sun day after day after day," she says. "I feel like I'm trapped and there's no relief from it. At my lowest point [last summer] I just wanted to die."

Or how about this one:


Or an article describing SUMMER MANIA.  You know this has to be true because of the huge number of degrees held by the author (B.A.ED., M.S., R.Sc.P, and Rs.D). 


Consider this one, describing how up to 600,000 Britons suffer from this affliction. How many of you look fearfully out of the window at sun and warmth?  Close your curtains to the sun? 


The Mayo Clinic describes Summer SAD (see article here) and lists its symptoms:
  • Anxiety
  • Trouble sleeping (insomnia)
  • Irritability
  • Agitation
  • Weight loss
  • Poor appetite
  • Increased sex drive
Now this is s not all bad.  Weight loss, increased sex drive and trouble sleeping!   Some folks might not complain...

Don't worry, help is on the way.

Take a look at the forecast 24-h precipitation ending 5 PM on Saturday.  Really heavy precipitation over southwestern B.C., the Olympics and the north Cascades...as much as 2-5 inches!  Our dry spell when end in a bang, if not a flood.


6 Ekim 2012 Cumartesi

KUOW- Hike of the week- Granite MT & Larch Lake

To contact us Click HERE
Updated 10-9-2012
Two hikes this week with fall colors. Featured hike is Granite Mt Lookout just west of Snoq Pass. Other hike is Larch Lake (see below)

Check out Green Trails Maps for directions. Map for this week's trip is 207 . Click link below for complete list of maps.http:// http://greentrailsmaps.com/maps/index_Map_wa/

Granite Mt LookoutDriving directions: From Seattle drive east on I-90 to exit 47 Turn north over the freeway, turn left at the T, and drive to Granite Mountain parking area.Trail stats: 8 miles roundtrip and 3800 foot gainPhotos below are from Larch Lake accessed via Scottish Lakes High Camp

Located 15 miles east of Stevens PassPhoto below Larch Lake
Photo below is of Larch Lake from above it
Photo below lots reds
Photo below is from Ewing Basin
Photo below fall colors
Photo below is view of Glacier
Photo below more colors
Photo below is from high meadow


Summer is Over on Friday

To contact us Click HERE
This is the blog I knew I would have to write eventually, and I suspect some of you will welcome it.

Our supernaturally dry, warm period is going to end on Friday.  We are close enough now and the agreement of the models are sufficient to suggest substantial confidence in this forecast (yes, there is a small probability it could be wrong).

Much of the region has had probably the finest late summer/early fall weather of the past half century, with the only downside being the fires, smoke, and our water bills.

Right now the atmosphere is locked in a very stable blocking pattern, one called a Rex Block (after Mr. Rex, not some king, although many of us might consider this royal weather).  In a Rex Block there is a ridge to the north and a closed low to the south in the upper level maps.  Here is the forecast map aloft (500 hPa) for 2 PM today to illustrate.  With a ridge over us, there is naturally a trough over the eastern U.S., where some folks are getting record cold and snow.

To illustrate what will happen this week, consider the sequence from the latest National Weather Service GFS model prediction (the European Center forecasts are very similar).

First, Monday.  Generally similar pattern and our warmth and lack of rain will continue.


 Thursday at 5 PM.  The block is weakening and you see flow coming in on the western boundary.  (this is when the Jaws music of impending doom should be played).  Still dry over us at this time, but with the closed low moving into southern CA, residents of LA will be cloudy and moistened a bit.  They can always retreat to their hot tubs.


 On Friday afternoon, the ridge is movingeastward, we are getting moderate westerly flow, and are weather is deteriorating, with clouds and perhaps some light rain on the coast.

 And here is Sunday afternoon. A strong trough moving just to our north and I suspect some light rain spreading to the NW interior.  No big storm, but coastal Vancouver Island could be quite wet.


Let me show you some fun graphics, never before shown on this blog...the cumulative rainfall from the NWS GFS model.  Here is the total rainfall falling between 5 PM this morning (Saturday) and Thursday at 11 PM.  Almost everyone get precipitation except us!  Even southern CA gets wet. 

And here is the same cumulative rainfall, but ending on Sunday at 5 AM.  Finally, some light rain spreads over the region.  Sorry.

Basically, our protective block is gone by next weekend and we will be vulnerable to passing storms in a progressive pattern.  Will the ridge come back?  Some models are hinting at it, so stay tuned.

5 Ekim 2012 Cuma

Presidential Debate Weather

To contact us Click HERE
There have been a number of suggestions, particularly from ex-Vice President Al Gore, that President Obama's lackluster performance had a meteorological origin (the effects of low atmospheric pressure in Denver on the President's mental functions).   Now a number of folks criticized this explanation, and they may be right, but I have an alternative.  Something else meteorological happened during the debates that has not gotten a lot of press. 


Now, first lets consider the pressure change idea...that the President flew into Denver that afternoon, while Governor Romney spent days in the mile-high city (which the pressure is about 15% less than at sea level).   One should note that the President spent several days in Las Vegas, Nevada (altitude 2402 ft), where the pressure is roughly half way between sea level pressure and that at Denver.  Furthermore, typical commercial aircraft are pressurized to roughly 7000 ft, so all his flight time would be promoting adjustment to lower pressure.  Finally, as far as I know, there is no scientific literature even suggesting much cognitive loss for even a rapid change from sea level to 5000 ft.  

But perhaps Al Gore was on to something.  Well, if it was not pressure, something else meteorological happened  EXACTLY THE SAME TIME AS THE DEBATE IN DENVER.  The answer:  an extraordinarily strong front passage, with a 20F drop in temperature in less than an hour, a rapid increase in pressure, and winds gusting to 40-50 mph!  Here are observations at the BAO tower in Boulder demonstrating this AMAZING front.


And here are the observations at the Denver Airport at the time. Impressive!

Many presidents are weather lovers (Washington, Jefferson, and Lincoln come to mind) and I suspect Obama is as well.  How can one pay attention when so much interesting and severe weather is happening outside?   I know I am greatly distracted when a storm is brewing outside....perhaps President Obama was as well. 

4 Ekim 2012 Perşembe

First Fall Cold Front, Dust Storm, and Major Records Fall

To contact us Click HERE

Late yesterday the first strong cold front of the fall moved across eastern Washington, bringing northerly winds gusting to 30-50 mph that picked up large amounts of material from the surface, and resulting in a veritable dust storm over large sections of the inland empire.  To illustrate, here are the weather observations Moses Lake Airport (time in GMT, 1752 is 10:52 AM, etc).  Wind gusts hit 41 knots at 5:52 PM and you can see reports of haze (H) and blowing dust (BD).


I have enhanced a visible satellite photo at 4:30 PM (shown below).  You can see the arc-shaped leading edge of the strong winds, with streams of dust behind.


 Substantially cooler air followed this cold front..on both sides of the Cascades.. and after the wind decreased late last night, several locations west of the Cascades had their first frost of the season.  Here are the temperatures and winds at 6 AM this morning around Seattle...what a contrast!  50s near the water and where there was some wind to stir things up, while mid to lower 30s over the eastern suburbs where the wind calmed out...lot of frost there for sure.  My vegetable garden is going downhill fast!


Finally, for those that love weather records, it is official.  The August-September precipitation at Seattle-Tacoma Airport (of .03 inches) was the driest in the 65-year record at that location.

It was the second driest in 65 years for July-September. 

1967 0.97 inches2012 1.072002 1.102003 1.271984 1.311990 1.34
In the Portland area, a number of locations had their driest July-September on record:

RECORD EVENT REPORT NATIONAL WEATHER SERVICE PORTLAND OREGON735 AM PDT TUE OCT 2 2012...DRIEST JULY THROUGH SEPTEMBER ON RECORD...VERY DRY CONDITIONS ACROSS THE REGION THIS PAST SUMMER INTO EARLYAUTUMN. FOR MANY LOCATIONS...JULY TO SEPTEMBER OF 2012 WILL GO DOWNAS THE DRIEST FOR THE PERIOD OF RECORD (POR).NEW RECORD DRIEST JULY TO SEPTEMBER FOR... JUL-SEP 2012 PREVIOUS RECORD NORMAL POR==================================================================PORTLAND AIRPORT 0.25 INCH 0.51 IN 1952 2.45 1940-2012VANCOUVER 0.28 INCH 0.57 IN 1952 M 1896-2012SALEM 0.11 INCH 0.23 IN 1952 2.17 1892-2012HILLSBORO 0.15 INCH 0.36 IN 1952 2.24 1929-2012SITES THAT FINISHED NOT TOP...BUT AS SECOND DRIEST ON RECORD JUL-SEP 2012 CURRENT RECORD NORMAL POR==================================================================PORTLAND DOWNTOWN 0.52 INCH 0.49 IN 1952 2.81 1890-2012EUGENE 0.21 INCH 0.18 IN 1942 2.45 1896-2012MCMINNVILLE 0.15 INCH 0.03 IN 1994 2.32 1894-2012  Forecast models indicate no rain for at least the next week.

3 Ekim 2012 Çarşamba

KUOW Hike of the Week- Mt Si traverse

To contact us Click HERE
Updated Tuesday July 17,2012
This is a different way to get to Mt. Si and it is a one way trip with a two car shuttle option. The flowers are at their peak now at the top- very unusual flower show!
All photos from Karen Sykes and GPS waypoints from Hiker Bob
Photo below is from Mt. Si looking at Haystack
Check out Green Trails Maps for directions. Map for this week's trip is 206S. Click link below for complete list of maps.http:// http://greentrailsmaps.com/maps/index_Map_wa/

Photo below is on the traverse route close to the Haystack
Photo below flowers at the top- Paintbrush
Photo below is view towards North Bend-Rattlesnake and Olympics
Driving directions: From Seattle take I-90 to exit 31 and go north (into town- North Bend). Then at North Bend Way turn right. In less than a mile you'll see the turnoff for Mount Si Road on the left and turn. If you have two cars park one at Mt. Si trail. Then take the other car and drive along Mt. Si road park at the school bus turnaround on your left (this is about 3 miles from North Bend Way). Hike up the logging road. If you have one car park one at school bus turnaround then at the end of the hike you will have a one mile road walk.
Trail stats: Start at GPS waypoint is N 47.48631 W 121.70093 872'. Hike up logging road 4.2 miles and about 3000 foot gain and on left you will find an unmarked old road on your left. This is the traverse section and is on Green Trails Map and GPS waypoint of N 47.50711 W 121.72758 3800'. Continue on this trail another .8 miles can you will be right below Haystack on bench to have lunch. Then hike down is 4 miles. Total if you have a car shuttle is 9.43 miles and 3500 foot gain. That is a workout!! Need Discover Pass to park
Snow Lake an easier hikeIf you want an easier hike you can hike towards Snow Lake but just hike to the ridge above the lake. It is 5 miles roundtrip with just a few areas of patchy snow. You can hike to the ridge top above Snow Lake but stop there since the lake is still snow covered with snow and ice on trail down to lake.To get to Snow Lake trailhead: From Seattle drive east on I-90 to exit 52. Turn left (north), and continue to the end of the road at the Alpental Ski Area parking lot.
Directions are best estimates. Please bring map and compass and or GPS

Washington Cascades Extended Weather

To contact us Click HERE
Issued Wednesday July 18,2012
Extended forecast through the end of the month are calling for temperatures to be below normal. The main reason for this is a weak trough of low pressure will be off the Washington Coast at times. This is illustrated with the map below (500 mb map-18,000 feet). With the a ridge of high pressure to our east and a trough to our west this will bring cooler temperaturesat times.

KUOW Hike - Boulder River

To contact us Click HERE
Update Tuesday July 24, 2012
This trail is just east of Arlington Washington off of Washington 530
Photo below, kids love this hike

Check out Green Trails Maps for directions. Map for this week's trip is 77 and 109. Click link below for complete list of maps.http:// http://greentrailsmaps.com/maps/index_Map_wa/

Photo below is lush old forest hike
Photo below is hiker enjoying one of the many waterfalls
Photo below is one of the many waterfalls views
Photo below is some of the wildflowers on the hike
Photo below water views really moving now with all the snow melt
Driving directions: From Seattle drive I-5 north and exit Arlington state Highway 530. Drive about 20 miles just past milepost 41 on. Turn right on French Creek road (FS 2012). Drive 3.7 miles to trail.
Trail stats: 8.6 miles round trip and 700 foot gain. You can go shorter and get great views of waterfalls.