To contact us Click
HERE
This week, with great fanfare, NASA scientist James Hansen and associates released a paper "
The Perception of Climate Change" in the journal PNAS that claims that recent heat waves and droughts were caused by human-induced climate change. To quote their abstract:
" It follows that we can state, with a high degree of confidence, that extreme anomalies such as those in Texas and Oklahoma in 2011 and Moscow in 2010 were a consequence of global warming because their likelihood in the absence of global warming was exceedingly small."This paper (found here) has been quoted in hundreds, if not thousands, of media outlets and newspapers and has garnered the praise of many environmental advocacy groups.
The problem?
Their conclusions are demonstrably false and their characterization of the science and statistics are deceptive at best. And the problem goes beyond this unfortunate paper. It extends to the way the media has misunderstood and miscommunicated our current state of knowledge of climate change. No wonder the public is confused, skeptic/denier groups hold on to wacky/unscientific theories, and our leaders dither on climate change. And let me repeat something I have said several times....I believe that human-induced global warming is both observed, real, and a serious problem for mankind. So if anyone wants to call me a denier or some other ad hominem name, please refrain from such remarks.
 Well, lets start with a little test
.
The heat waves/droughts in the mid-section of the U.S. during past two years were caused by:
a. 90% natural variability and 10% human-induced global warming
b. 50% natural variability and 50% human-induced global warming
c. 10% natural variability and 90% human-induced global warming
Time is up! Write down your answer. As I will try to demonstrate, the correct answer is probably very close to (a).
90% of the temperature anomaly this and last summer is the result of natural variability with a minor assist from global warming.
Really different than the impression you are getting from Dr. Hansen and the media, right? But it is the truth.Let me prove to you now that Dr. Hansen's claims are deceptive. Consider the heat wave in Texas/Oklahoma last year. Below you will find the mean temperatures for July and August over the U.S. (top panels), while below are the differences (anomalies) from normal (or climatology). The anomalies were over 8F in July and over 7F in August.
How big could the global warming signal be? And particularly the warming due to mankind's emission of greenhouse gases? The IPCC is the world scientific body that has examined such questions. They note that human influence should have become significant somewhere in the mid-70s and the generally accepted estimated of the warming of the Northern Hemisphere since then is roughly 1F or C (see IPCC graphic below).
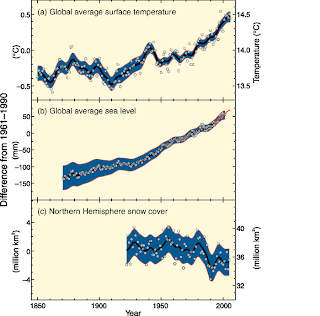
Now this warming could well include some component of natural warming (particularly since there had been warming since the end of the 1800s).
But lets assume it is all due to human-emitted greenhouse gases. The full one degree F.
But what about Texas and Oklahoma? The hemispheric value includes the Arctic over when the IPCC has shown the warming is far larger than anywhere else (due to melting sea ice for one reason). Here are the temperature changes over all of Texas for June to August. A big spike in 2011...but what about the long-term trend? ...that would be the trend associated with global warming. Nearly flat, but perhaps we can convince ourselves there was a small upward trend since 1970 of perhaps .5-1F. And remember these observations are contaminated by urban heat island effects.
So I think you can see that the global warming signal due to human-emitted gases could not possibly be more than 1F, and is probably much less.
Yet the heat wave last summer, expressed as monthly anomalies, reached 7-8F over large portions of Texas and Oklahoma.
What can you conclude?
Something other than global warming produced the lion's share of the heat wave...and we know what it was: a major change in the circulation over the U.S. last summer. A big area of high pressure and high heights over the center of the U.S. The graphic below shows the differences of the upper level (500hPa) heights from normal over the U.S. for last summer. Green indicates above normal heights (a ridge) and blues indicate lower heights (trough). So last summer we had a persistent pattern of mid-continental ridging and troughing on the coast. This summer has been the same. The upper level flow pattern has amplified in a wave-like way.
And there is no reason to think, based on theoretical or observational research that this is anything but natural variability. 
To put it another way: in July of last year, at least 7/8th (87%) of the warming was due to natural processes, and the truth surely was well over 90%. It is funny that Dr. Hansen and others exaggerating the effects of human emissions don't say it this way.
The correct way.The media, repeating this stuff, provides deceptive storiesy to their readers. And the damage to the credibility of my profession is huge.
As an aside, the journal that this article was published in...the Proceedings of the National Academy of Sciences (PNAS)...allows members of the National Academy (like Dr. Hansen) to publish articles with essentially no peer review. Until 2010 they could publish anything, with no peer review, and most recently the submission review is "supervised" by the submitting academy member WHO GETS TO SELECT THE REVIEWERS. Folks, this is really unfortunate for an entity that claims to be national journal of some reputation. The result has been a lot of very bad papers in PNAS that would never have been accepted in real journals,with a real peer review process. One could use stronger words, but this is a family blog.
So you think these exaggerations of Hansen and his fellow-travelers is bad enough? It is much worse than that. They spend a lot of time talking about statistics (bell curves) and how warming is producing more extremes. But they don't give folks the straight story...let me explain.
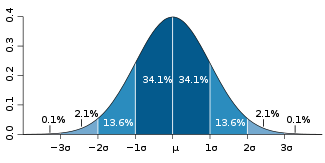
Many atmospheric and other variables follow a bell curve (a.k.a. a Gaussian) in which most observations are near the mean and then the frequency drops away towards extremes on both sides (see graphic). So the probability is highest that the observation is near the mean and probabilities drop for higher and lower values. An important aspect of the bell curve is the standard deviation (indicated by Greek letter sigma). You can calculate this number from the observations (I won't go into that here, but it is straightforward and in all statistics texts). Turns out the that if the observation type is well described by a bell curve (and temperature generally is), 68% of the observations should fall within one standard deviation (one sigma) of the mean (both above and below). The graphic shows this with the dark blue color. Roughly 95% should fall within two sigma of the mean (dark plus medium blue), and roughly 99% within 3 sigma. So very few observations..the most extreme should fall more than 3 standard deviations from the mean.
Now as the earth warms up the temperature variations shown remain like the bell curve...or Gaussian, but the mean should shift to warmer temperatures (see the figure below). The result is that you get more warm extremes and less cold extremes (less cold extremes are not mentioned very often for some reason).

So the result is that you seem more warm temperature records and less cold temperature records. We are in fact seeing this. The earth is warming and there are more maximum temperature records than cold ones. Hansen and friends make a big deal about this.
But what they are not telling you is that the very warm anomalies we are seeing today would have been nearly as large if global warming had never occurred. In his paper he makes a big deal about large (three sigma) anomalies from climatology. Well, without any global warming the anomalies might have been say 2.8 sigma. Or in terms of terms, heat waves of 10F might have been
only 9F if global warming had not occurred. To say it differently, the impact of global warming due to greenhouse gases is still small compared to natural processes, and the impacts to society would have been pretty much the same.
But you never hear it this way. Those exaggerating the global warming signal imply that we are going from normal conditions to extremes due to global warming. In reality, we go from naturally induced extremes, to a bit stronger extremes due to global warming.
Let me say it am alternative way. You can see from the bell curve that the probability of a certain temperature changes rapidly when you are on the sides of the bell curve. So if the bell curve shifts warmer, you get a big change in the probabilities of high temperatures. So you get a lot more records even if the warming...and the impacts of the warming...are not that large.
Lets be clear here. Although the global warming signal is relatively week today in most of the planet (outside of the Arctic), our best science indicates that the warming will greatly increase by the end of the century. At this point, the human-induced warming will be much more comparable to the natural variability and our climate will truly be different.
Unfortunately, a very limited, but highly visible, group of scientists like Hansen are choosing to tell a story that is not supported by the facts, with a media that is happy to amplify such claims. Global warming due to greenhouse gas emissions of mankind is a very serious issue...one which our civilization is not dealing with in an effective way. But scientists must give society the straight facts and not shade or exaggerate the facts based on our personal views on what should be done.
Announcement: Columbus Day Storm 50th Anniversary Gala at the UW: Oct. 11, 7:30 PMOn Thursday evening, October 11 at 7:30 PM, the UW will host a gathering to review and remember the 1962 Columbus Day Storm (October 12th will be the 50th anniversary). I will discuss the major aspects of the storm and windstorm chronicler Wolf Reed will tell even more. The Mt. Hebo radar dome broke apart that night as winds gusted above 150 mph, and we will have an eye witness account. And there will be time for your comments, questions, or stories. Steve Pool of KOMO TV will MC. This meeting should be great fun will take place in Kane 120 on the UW Seattle campus.
You need to register for this if you want to go, since I expect it to fill. To do so, go here. The gathering is free, but the expenses are being covered by my research fund, so any contributions to offset the costs are very welcome.
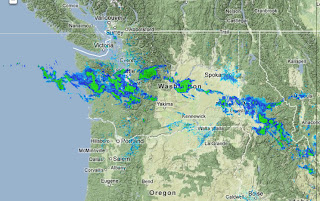 The visible satellite picture shows the line of showers very nicely. You can also see the low clouds over the Pacific and the fact that some of the clouds started to move inland a bit.
 This feature is moving northward and the associated clouds should reach the Canadian border by dinnertime. Even now, the clearing is approaching Olympia.
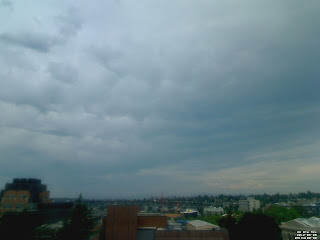 morning I noticed so mammatus clouds....hanging hemispherical features extending below some of the cloud base (you can see a suggestion in the image above). Really neat. Here is what these kinds of clouds look like:
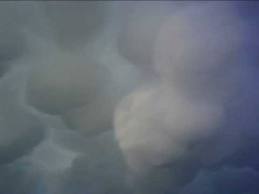 So later today you will see clearing (except for the coast) and tomorrow could have some morning clouds that will burn off by lunchtime. A step cooler and cloudier on Wednesday as the marine influence strengthens. No heat wave for next weekend....


 Here is the forecast for Saturday at 5 PM. Perhaps a slight break, with more on the way.


